A star can look like a point of white light while carrying a remarkably detailed message. Spread that light into its component wavelengths and the point becomes a spectrum: a pattern whose bright and dark features can reveal what happens in and around the star.
In the nineteenth century, Jesuit astronomer Angelo Secchi helped make those patterns into a way of classifying stars. Working at the Roman College's observatory, he examined thousands of stellar spectra and grouped them by recurring features. This work contributed to the emergence of astrophysics, the investigation of what celestial objects are physically like. The Vatican Observatory's account of Secchi's work.
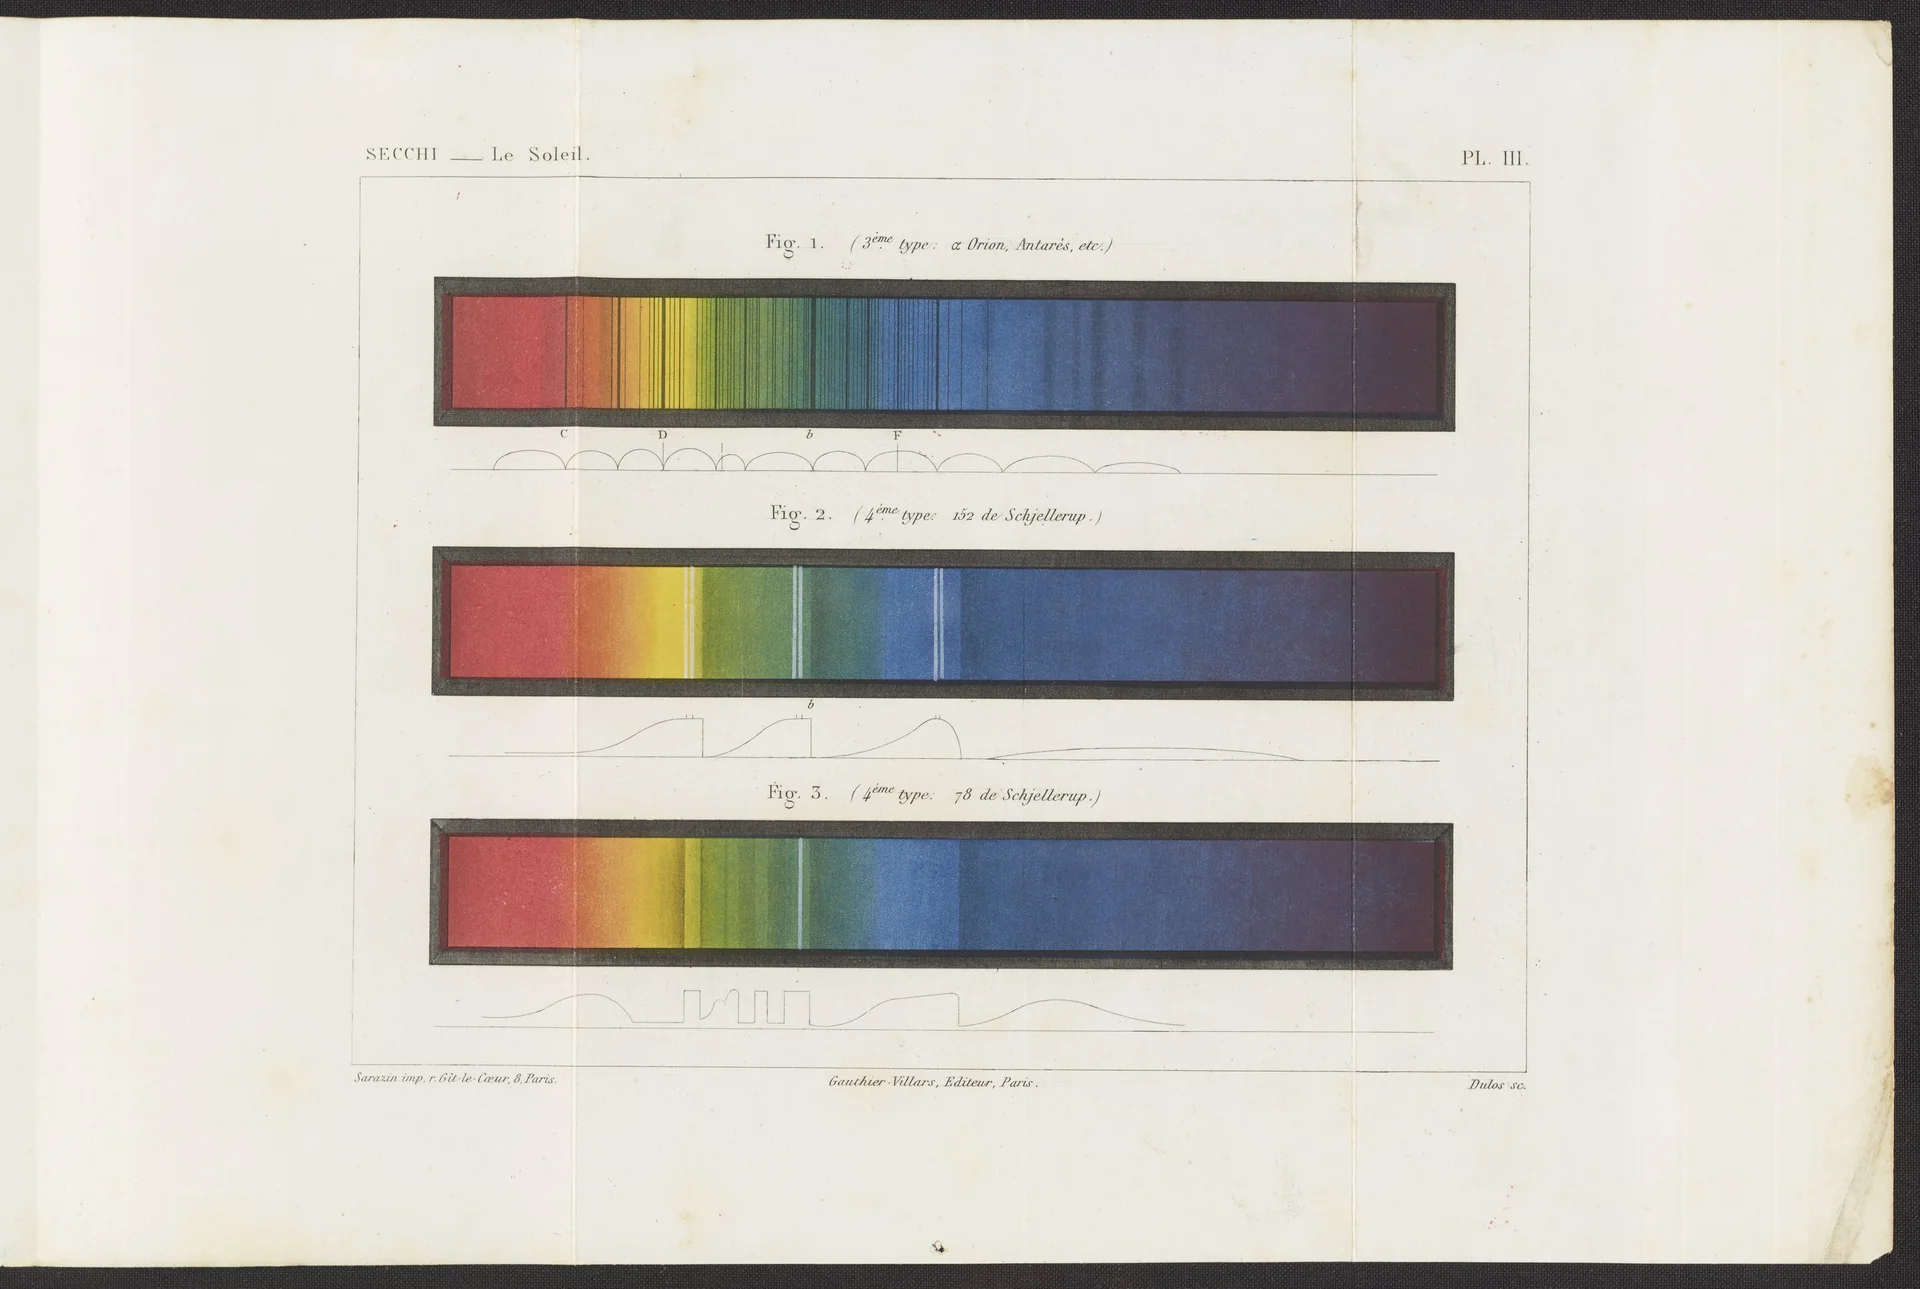
The diagrams in Secchi’s books let a reader see the comparisons he was making. In his 1877 Le Stelle, Sirius represents one stellar type; the Sun represents another. Stars that look like points can leave very different patterns on a spectroscopic chart. INAF’s account of the volume in its Arcetri collection.
A rainbow with information missing
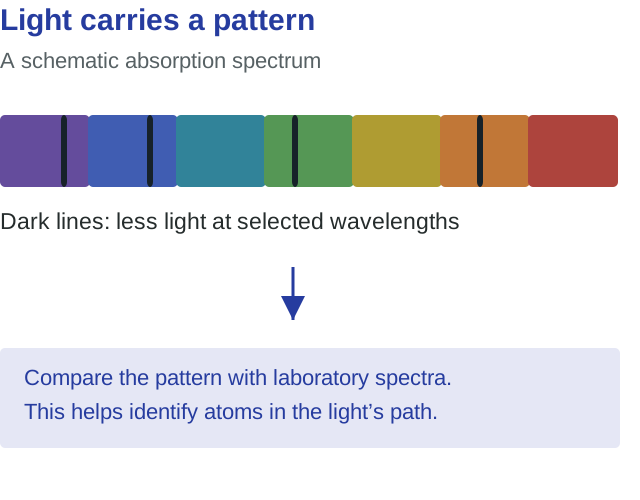
White light combines many wavelengths, which our eyes register as different colors when they are separated. A spectrum records how much light arrives at each wavelength. It can be displayed as a colored strip or, more usefully for measurement, as a graph of intensity against wavelength.
A hot, dense source produces light across a broad range. When that light passes through cooler gas, atoms and molecules can absorb particular wavelengths. The result contains absorption lines: places where less light reaches the observer. A sufficiently thin glowing gas can instead produce emission lines at characteristic wavelengths. NASA's explanation of continuous, absorption, and emission spectra.
The crucial point is selectivity. Matter does not interact with all light in the same way. Different atoms and molecules have different patterns of allowed energy changes, so their interactions leave distinguishable signatures. Comparing an astronomical pattern with laboratory knowledge connects a remote object to physical processes studied nearby.
This is more informative than simply assigning a star a color. Two spectra may have similar overall colors but different line patterns. Conversely, the same chemical element can produce different visible features under different physical conditions. Interpretation requires a model of how the light was produced and modified.
Finding families among stars
Secchi's observations revealed recurring spectral types. Some stars displayed strong hydrogen features; others had patterns of numerous lines or broad bands. His scheme developed over time, and later astronomers reorganized and extended stellar classification. He did not single-handedly devise the modern system. His contribution was to demonstrate the value of sustained comparison across a large sample. Secchi and the history of spectral comparison.
One of those plates separates light from the Sun’s visible surface from light of its chromosphere, a layer of its atmosphere. The former shows dark absorption lines; the latter includes bright emission lines. Even one object can produce different spectra depending on the region observed. Secchi’s comparisons therefore required attention to the observing circumstances as well as to the pattern. INAF on plate III of Le Stelle.
Modern interpretation connects the overall distribution of a star's light to temperature and examines spectral lines for information about composition and physical conditions. A missing or weak line does not automatically mean the corresponding element is absent. Temperature affects the states atoms occupy and therefore which interactions with light are possible. NASA's spectroscopy guide.
A classification makes a question precise enough to investigate: which physical differences produce these recurring patterns? Secchi’s groups helped pose that problem. Later theory and observations supplied explanations and a reorganized system of stellar classes.
Testing whether a feature belongs to the Sun
Secchi also studied the Sun. During the total eclipse of 1860, he photographed prominences, the structures visible near the obscured solar disk. Warren De la Rue obtained photographs at another observing location. Comparing images helped establish that the features belonged to the Sun rather than being local atmospheric effects. The Observatory's account of the eclipse observations.
The logic is worth lingering over. If a phenomenon arises near one observer, moving far away can change or remove it. If separate observers record matching structures in the same relation to a distant object, the distant-object explanation becomes stronger. Agreement is especially informative when the observations have different local circumstances.
This located the phenomenon before explaining its physics. A feature attached to the Sun should remain in the same place relative to the Sun in the two sets of images, despite the observers’ separation. The photographs made that comparison possible.
A religious vocation with physical work to do
Secchi’s working place also records a practical choice. As director of the Roman College observatory, he moved it onto the church of Saint Ignatius to obtain a more stable platform. The building’s support mattered to the observations; the religious institution supplied a setting in which they could continue. The Observatory’s account of the move.
For Catholic readers, the history offers an example of a vocation that included sustained attention to material reality. The work required mathematics, instruments, collaboration, and correction. Those demands were not bypassed by a religious purpose. Whatever spiritual meaning Secchi found in the heavens, a classification still had to survive comparison with more spectra.
A reader can follow those observations without sharing his faith. That common access to the evidence is one of the gifts a religious scientist can offer: work that another person can test, use and improve.
Reading farther
Modern spectroscopy reaches far beyond the visible rainbow. Instruments examine ultraviolet and infrared wavelengths as well, extracting information about composition, motion, temperature, and environment. Hubble's spectrographs illustrate how a telescope can be a measuring instrument even when the result is less immediately picturesque than a galaxy photograph. NASA's account of Hubble spectroscopy.
Open the account of Secchi’s plates and look for the difference between the solar absorption and emission spectra. Then compare NASA’s explanation of the same physical distinction. The old chart records differences that a reader can learn to recognize and explain.